Housing market trash

I've got a 800sq ft house drawn up that I would love to retire into. Easy to keep clean and would have an extra bedroom for grandkids. I really hope to downsize when the kids are grown and gone.

I have a rental, that was my 1st home, that is that size. I could see moving back there at some point, but it really needs a bigger lot. By that time, I might feel differently.
 
Frankly, I’ve been wondering if those types of communities are going to be the ticket once boomers really start hitting retirement. Par 3 golf course, a pond and a club house…with 100ish mini units…sell the unit, lease the land…I’d toss some coinage at that in Florida somewhere.
we just built 27 town houses at 1200 sf a piece on a golf course and they were priced so high i didnt think they'd sell. hell they were all sold before i got the foundations in for the first triplex
 
we moved into a grandparents house. its old needs lots of repairs and is right around a 1000 sf, but has 1.5 acres and a 2800sf shop. told miranda house can be renovated so there no reason for us to leave until we find us a nice big piece of property.
I'm in the same boat. My dads old place is going to take a complete remodel...It's 4.5 acers but no shop. I walked it off sunday and I think I can squeeze a 60x40 shop in a good spot.
 
these neighborhoods have been going up in FL for years now. I worked in one a decade ago, and there were 5 more on the same street. Zero lot line, and ~1000sqft. Want a bigger lot, add a pool.

Yeah…I don’t think it’s an original idea, I just think the volume of them will become prevalent. When I visit my grandparents, seems there’s a 5-10mi radius with an old folks community on darn every block. Common theme seems to be, provide all maintenance, a common activity center, small lot and sub-1500sq/ft. I just see tiny homes being the new, ‘in vogue’ camper/trailer/cinder block/condo/town home.
 
I'm in the same boat. My dads old place is going to take a complete remodel...It's 4.5 acers but no shop. I walked it off sunday and I think I can squeeze a 60x40 shop in a good spot.
we moved in quick when our house flooded. so its livable now, in the next few years id like to put a heatpump system in and remove all the exterior wall paneling and add insulation and sheetrock take out the ceilings and vault them but we got plenty of time.
 
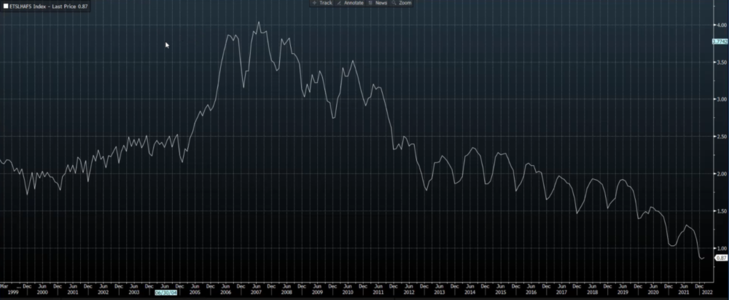
US Existing Home Sales Inventory, 1999 to current:

1649798811230.png
 

Attachments

  • 1649798755292.png
    1649798755292.png
    321.9 KB · Views: 73
Part 2:

Really good articles.
This part especially hits home for us in NC:
"Net migration within the US represents a form of shifting demand for housing, not necessarily new demand creation overall. Some people will look at the U.S. as a whole and say there’s 130 million households and 142 million housing units, we’re over built and don’t need new homes. But the overall numbers don’t tell the full story, as the common refrain in real estate goes, “location, location, location.” For example, if there are 50 people living in 50 homes in California and 25 people living in 25 homes in Texas then there is equilibrium with 75 people total in 75 homes. However, when 25 of the people in California people move to Texas, it doesn't matter that cumulatively you have 75 homes for 75 people. You now need to build 25 more housing units in Texas. In other words, demand has shifted geographically, and supply needs to follow. While a simplistic example, the numbers bear this out."

And that…specifically…is what I was trying figure out with the previous comments. Shortage, sure…but where and what demographic specifically.
 
So do we trust the official numbers or not?
The official CPI numbers don't include all kinds of shit that you'd expect would be in there.

In fact, they change the calculation periodically so that it "better reflects" real-world conditions. I've heard that if they calculated it as it was done before the mid-80s, it would be well into the double-digits this year.

Also, that chart was in the article @drkelly linked:
1650379996382.png


They are comparing income vs disposable income, so not the same charts.

And how does "share of disposable income" (percent of disposable income) get calculated anyway? If it averages 5%, then that implies 5% of your disposable income goes toward mortgage. But wouldn't your mortgage come first, so you just have less disposable income? Not picking on you @shawn (that was up there in the first part :p), just questioning the basis and pertinence of this calculation to begin with.
 
Last edited:
So do we trust the official numbers or not?


Also, that chart was in the article @drkelly linked:
View attachment 371061


They are comparing income vs disposable income, so not the same charts.

And how does "share of disposable income" (percent of disposable income) get calculated anyway? If it averages 5%, then that implies 5% of your disposable income goes toward mortgage. But wouldn't your mortgage come first, so you just have less disposable income? Not picking on you @shawn (that was up there in the first part :p), just questioning the basis and pertinence of this calculation to begin with.
yeah I've really been struggling with this statistic and would love to know what it is based on.

It sure as shit doesn't mean that on average people are putting only 4% of their disposable income (which is normally defined as income after paying taxes) to a mortage payment. That would be tiny. Like you're telling on average somebody that brings home $5k after taxes has a mortgage payment of $200? Or $10k is $400? I do not know a single person like that. According to Teh Googlez the average mortgage payment was around $1400... in 2019. That would mean the average disposable income was $35k... a month....

Could it be that its the total share of all debt payments out of all disposable income of everybody pooled together? If so.... that seems pretty meaningless bc yeah it's highly biased by the people who have income but no payment, driving up the pool, and not at all representative of the typical individual. And so this graph really just means we have a more people today that own their home w/ no payment than in 2008.
But thats just a guess.
 
Last edited:
Who comes up with these statistics and graphs? They sound made up. No one has interviewed me or anyone I know about how much they make vs. spend on a mortgage.
No interview needed, your lender and a bunch of other people, including Facebook, already has the data and is happy to sell it to a marketing research firm.
 
Back
Top