Folks that live in the hills full time don’t put houses on the peak. The wind gets insane.I like it, and was gonna go halves with my distant cousin @drkelly, but with the house at 1600ft elevation, I'm out. They could have at least put it on top of the mountain:
View attachment 356927
Plus, 1800ft ain't a mountain, that's just a big hill. Gotta get up to at least 3000ft to get the edge off the summer heat.


You are using an out of date browser. It may not display this or other websites correctly.
You should upgrade or use an alternative browser.
You should upgrade or use an alternative browser.
Housing market trash
- Thread starter DonYukon
- Start date
1-tonmudder
Doin my part to stir the pot.
- Joined
- Apr 17, 2005
- Location
- Greeneville TN
while we're on the subject housing market trash has anyone ever heard of selling a foreclosed property while its occupied and the new buyer has to do the evicting??? This has been on da face books today.They have listed at least two properties that way,
.png")
- Joined
- Apr 16, 2005
- Location
- Sharon, SC
Yes very common actuallywhile we're on the subject housing market trash has anyone ever heard of selling a foreclosed property while its occupied and the new buyer has to do the evicting??? This has been on da face books today.They have listed at least two properties that way,
View attachment 362111
drkelly
Dipstick who put two vehicles on jack stands
- Joined
- Mar 21, 2005
- Location
- Oak Ridge/Stokesdale, NC

Boom, bust, or boring? Where the housing market is going in 2022 as told by 7 forecast models | Fortune
To see what home price growth is likely to look like next year, Fortune reviewed seven industry forecast models.
- Joined
- Mar 13, 2005
- Location
- Raleigh, NC
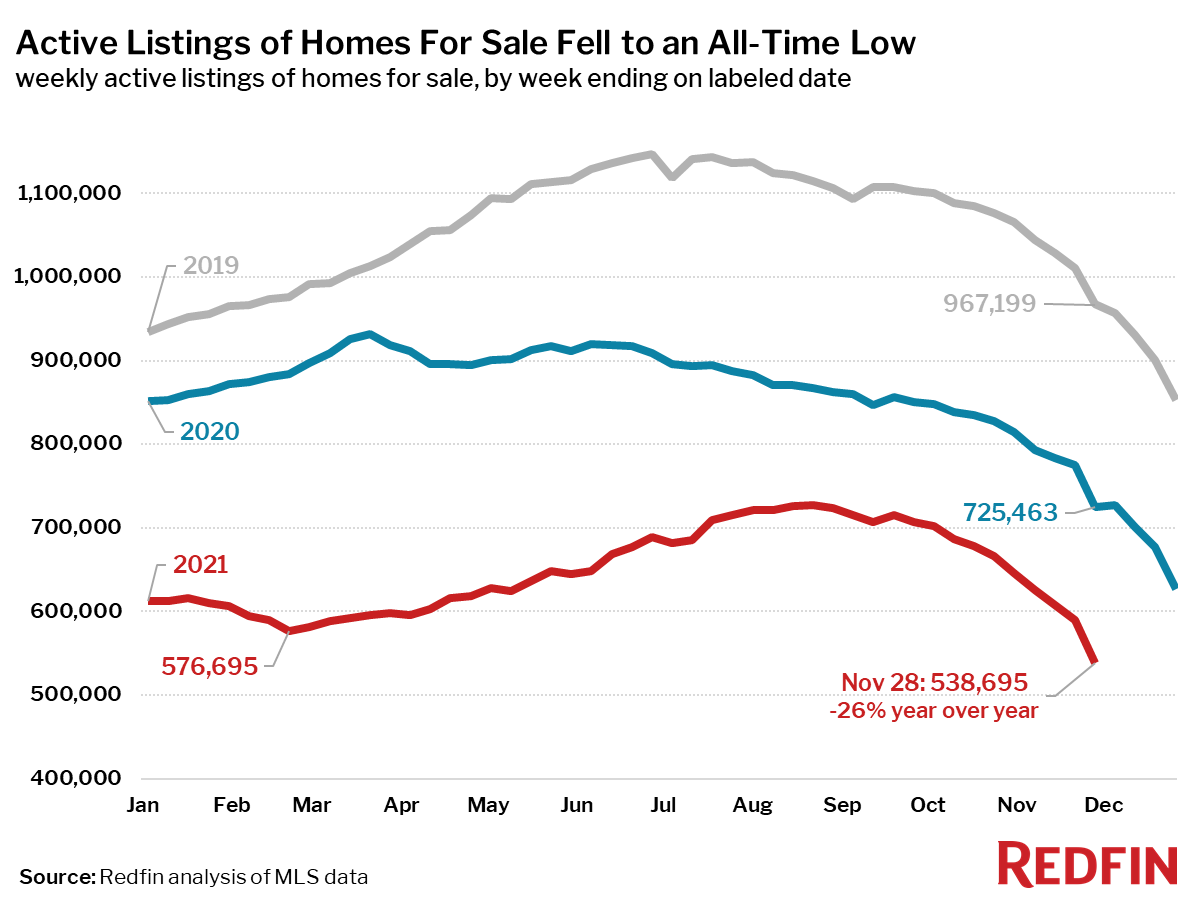
US active listings for Nov 2021 was down to 538,695. 11/19 was 967,199, 11/20 was 725,463.
Asking prices up 12% YOY
 www.redfin.com
Asking prices up 12% YOY
Housing Market Update: For-Sale Home Supply Hits All-Time Low
Home prices hit a new all-time high as it became even more common for homes to find buyers within one week.
DSM Turbos
Well-Known Member
- Joined
- Feb 25, 2006
- Location
- Raleigh, NC
US active listings for Nov 2021 was down to 538,695. 11/19 was 967,199, 11/20 was 725,463.
Asking prices up 12% YOY
Housing Market Update: For-Sale Home Supply Hits All-Time Low
Home prices hit a new all-time high as it became even more common for homes to find buyers within one week.
based on the graphs though, it doesn't seem any more disproportionate to the trends from the rest of the year. meaning its not a larger % drop then we are used to during this time of year
US active listings for Nov 2021 was down to 538,695. 11/19 was 967,199, 11/20 was 725,463.
Asking prices up 12% YOY
Housing Market Update: For-Sale Home Supply Hits All-Time Low
Home prices hit a new all-time high as it became even more common for homes to find buyers within one week.
I know it's crazy and I should be used to it, but seeing the graphs and the numbers just blows my mind over and over.
Futbalfantic
Well-Known Member
- Joined
- Aug 5, 2006
- Location
- Charlotte
I think that depressed supply is also meeting a depressed demand. But all of these “cash investers” and drying up the market driving up prices way faster than they should be.
- Joined
- Apr 16, 2005
- Location
- Sharon, SC
Demand in the SE is at a record high.I think that depressed supply is also meeting a depressed demand. But all of these “cash investers” and drying up the market driving up prices way faster than they should be.
Supply represents whats on the market and its record low. Closed transactions are at a record high.
People still fleeing the rust belt in epic volumes. The onyl thing tat will quell demand is multifamily growth and those developers are strategically planning to discourage home ownership over the next 10 years
- Joined
- Mar 13, 2005
- Location
- Raleigh, NC
I think that depressed supply is also meeting a depressed demand.
If that were the case, days on market, pending sales, and sale-to-list ratio would reflect less demand.
We're short several million houses nationwide to meet demand.
Housing in the US has not been able to keep up with buyer demand over the past decade
We talked to three experts and looked at housing data to take a closer look at the shortage of new homes despite demand and a growing population.
Futbalfantic
Well-Known Member
- Joined
- Aug 5, 2006
- Location
- Charlotte
How is that. If investors are buying 20% of housing that cannot have anything but a detrimental effect. ESP if they are continually increasing their share of market ownership and not releasing them back into the market.If that were the case, days on market, pending sales, and sale-to-list ratio would reflect less demand.
We're short several million houses nationwide to meet demand.
- Joined
- Mar 13, 2005
- Location
- Raleigh, NC
The funds I'm familiar with are required to turn over their stock every 10 years. I haven't seen any data that indicates the percentage of rental SFR has changed significantly. The biggest change since 09 is that small investors have been displaced by large institutions.ESP if they are continually increasing their share of market ownership and not releasing them back into the market.
Regardless, you're talking about two different issues. Since 2009, we have consistently built fewer places for people to live than are needed (several 100k/yr). This is regardless of whether the property was a SFR, apartment, occupant-owned or rented. That lack of creation causes a dearth of supply, regardless of any other factors.
- Joined
- Mar 24, 2005
- Location
- Stanley, NC
Where did all the demand suddenly come from?
awheelterd
Well-Known Member
- Joined
- Oct 18, 2007
- Location
- Kenly, NC
Free money!Where did all the demand suddenly come from?
- Joined
- Mar 13, 2005
- Location
- Raleigh, NC
Demand didn't suddenly appear. Why are you saying it did?Where did all the demand suddenly come from?
UTfball68
Well-Known Member
- Joined
- Jul 18, 2008
- Location
- Granite Quarry
Demand didn't suddenly appear. Why are you saying it did?
My interpretation of his question would be…the numbers show the ‘housing shortage’ has been there for years…but I don’t think we’ve seen this pricing push upward since before the sub-prime bubble. So where was everyone with this cash over the last decade? Is there a difference between ‘shortage demand by head’ and ‘shortage by people having enough cash in their pocket to buy’? Meaning, yeah…I want to buy a private island, so there’s (unrealized?) demand there, but I don’t have the cash to actually buy one…but if I get a $10mil stimmy check, now there’s a real chance of me acting on that purchase.
- Joined
- Mar 13, 2005
- Location
- Raleigh, NC
That tick at the right side is mostly devaluation of the dollar.
83oldyoda4x4
Well-Known Member
- Joined
- Jan 13, 2008
- Location
- Randolph co, NC
I can tell you when i was looking for a house back in 2016 it wasn't a fun time either. Not as bad as the last two years but.
- Joined
- Mar 24, 2005
- Location
- Stanley, NC
Demand didn't suddenly appear. Why are you saying it did?
Yep, that covers a lot of it.My interpretation of his question would be…the numbers show the ‘housing shortage’ has been there for years…but I don’t think we’ve seen this pricing push upward since before the sub-prime bubble. So where was everyone with this cash over the last decade? Is there a difference between ‘shortage demand by head’ and ‘shortage by people having enough cash in their pocket to buy’? Meaning, yeah…I want to buy a private island, so there’s (unrealized?) demand there, but I don’t have the cash to actually buy one…but if I get a $10mil stimmy check, now there’s a real chance of me acting on that purchase.
Notice that prices basically flat for 5 years from 2015-2020, other than some normal inflation. Then all of a sudden things go apeshit. So...
Did a bunch of people show up? You know I agree completely about inflation, but you are saying demand is the price driver, not inflation. Also, your chart has a deceptive start point. Stretch it back a little further, and you'll see a dip (or artificial bump) leading up to 2010:Where did all the demand suddenly come from?
Things were pretty dang linear until Covid/Lockdowns/Shortages:
If you look at the population growth line, and that highly technical linear overlay I did on the housing price graph, they aren't too far apart on the slope. In fact, the average housing price was trending fairly close to right at $1 per person, which is an interesting correlation. But then notice the population growth rate has slowed a bit, while housing prices have jumped.
All that to say: I think there is an artificial perception of excessive demand that is driven by low interest rates, massive inflation, FOMO/hysteria, corporatization of residential home ownership, market manipulation (see article about Zillow bowing out because they can't manipulate the market enough to be profitable anymore), and most everyone's natural desire to upgrade, plus general stupidity in a Covid world, which is driving us into 2008 Remix. There are too many people making too much money on it, and it's in their best interest to keep it going, even if it doesn't make sense.
awheelterd
Well-Known Member
- Joined
- Oct 18, 2007
- Location
- Kenly, NC
That's my feeling on it as well. All the articles you read about home demand being strong for several more years and that the current market is in no way a bubble always quote redfin, Zillow, Ryan homes, etc as their experts. WTF? Of course they are all going to say the party will go on forever, their fortunes depend on the music not stopping. I have a hard time believing that there were enough folks living in mom and dads basement pre-pandemic that can all of a sudden afford a $350k house a year and a half later. The math doesn't add up.Yep, that covers a lot of it.
Notice that prices basically flat for 5 years from 2015-2020, other than some normal inflation. Then all of a sudden things go apeshit. So...
Did a bunch of people show up? You know I agree completely about inflation, but you are saying demand is the price driver, not inflation. Also, your chart has a deceptive start point. Stretch it back a little further, and you'll see a dip (or artificial bump) leading up to 2010:
View attachment 363004
Things were pretty dang linear until Covid/Lockdowns/Shortages:
View attachment 363005
View attachment 363007
If you look at the population growth line, and that highly technical linear overlay I did on the housing price graph, they aren't too far apart on the slope. In fact, the average housing price was trending fairly close to right at $1 per person, which is an interesting correlation. But then notice the population growth rate has slowed a bit, while housing prices have jumped.
All that to say: I think there is an artificial perception of excessive demand that is driven by low interest rates, massive inflation, FOMO/hysteria, corporatization of residential home ownership, market manipulation (see article about Zillow bowing out because they can't manipulate the market enough to be profitable anymore), and most everyone's natural desire to upgrade, plus general stupidity in a Covid world, which is driving us into 2008 Remix. There are too many people making too much money on it, and it's in their best interest to keep it going, even if it doesn't make sense.
- Joined
- Mar 13, 2005
- Location
- Raleigh, NC
Your scales are completely different, so the slopes aren't comparable.
Go back and look at the housing formation change over time. There aren't enough homes of any sort being built in order to meet demand. There are numerous data points that agree on this.
I didn't say demand is the only price driver. Others said demand is down. I don't have any evidence that's the case (other than seasonality). Lots of talk about how the increase in home prices is transitory, but prices of everything are up across the board, and dollar is down. WFC just said we had the highest inflation print in 30 yrs.
The big takeaway from the recent redfin report is that a lack of supply (and the continual decrease in supply over the last 5 yrs) is going to make any drop in prices unlikely. That's irrespective of the inflation discussion, which I think essentially means taking whatever you think something "should" cost and multiplying that by 1.3x (+/- 10%).
Edit: don't forget that housing starts were cut in 2020 because of covid, and again in 2021 because of covid-related inflation and material scarcity.
Last edited:
- Joined
- Mar 13, 2005
- Location
- Raleigh, NC
There are 100mm more people in the US than 30 years ago.The math doesn't add up.
awheelterd
Well-Known Member
- Joined
- Oct 18, 2007
- Location
- Kenly, NC
Well yeah, but what about the last 24 mos? That's when demand started exponentially growing. All those buyers didn't simultaneously graduate from college and start making offers on $300k homes did they?There are 100mm more people in the US than 30 years ago.
- Joined
- Mar 13, 2005
- Location
- Raleigh, NC
Well yeah, but what about the last 24 mos? That's when demand started exponentially growing. All those buyers didn't simultaneously graduate from college and start making offers on $300k homes did they?
Actually, yes. If you're talking about SFR, supply dropped (fewer got built) and (at the very least) demand stayed flat (people realized living in an apt downtown wasn't fun with all the restaurants and amenities closed). Go back and look at all the stories about houses in CT that had been on the market for years that suddenly sold for way over asking in summer 2020. Meanwhile, rents in the cities dropped.
- Joined
- Mar 24, 2005
- Location
- Stanley, NC
The scales are much more proportional than you give them credit for, and are absolutely comparable. They aren't the same, but the trend is consistent until 2020. If you factor in inflation, houses prices trended dead on through 2020.Your scales are completely different, so the slopes aren't comparable.
| Year | Avg Price | Infl Rate |
2005 | $ 280,000.00 | 1.0339 |
2006 | $ 289,492.00 | 1.0323 |
2007 | $ 298,842.59 | 1.0285 |
2008 | $ 307,359.61 | 1.0384 |
2009 | $ 319,162.21 | 0.9994 |
2010 | $ 318,970.72 | 1.0164 |
2011 | $ 324,201.84 | 1.0316 |
2012 | $ 334,446.61 | 1.0207 |
2013 | $ 341,369.66 | 1.0146 |
2014 | $ 346,353.66 | 1.0162 |
2015 | $ 351,964.59 | 1.0012 |
2016 | $ 352,386.94 | 1.0126 |
2017 | $ 356,827.02 | 1.0213 |
2018 | $ 364,427.43 | 1.0249 |
2019 | $ 373,501.68 | 1.0176 |
2020 | $ 380,075.31 | 1.0123 |
2021 | $ 384,750.23 | 1.0687 |
2022 | $ 411,182.57 |
Anyway, I think its because inflation and hypertardism, and you think its inflation and demand. We can both agree that inflation is more than the %6.whatever the national association of professional con-artists says it is.